
UK financial services sector gender pay gap ‘Walk vs Talk’ report
The INSIG AI “UK Financial Services Sector Gender Pay Gap ‘Walk vs Talk’ Report” uses a combination of technology and manual data validation, to analyse the relationship between pay gap disclosure levels and the reported hourly gender pay gap in the financial services sector and has been featured in:
IFA Magazine: Link
Markets Media: Link
Commercial Risk: Link
The full report can be found below:
For UK Large Cap companies in the Financial Services sector, Insig AI’s ESG data specialists asked – “What is the relationship between the actual Gender Pay Gap, and levels of disclosure around the issue?”
The data revealed that
- 14 of the 20 FTSE 100 companies in the Financial Services sector currently have a higher than average gender pay gap
- Of these, 9 also show higher than average pay gap disclosure levels
- Large dispersion and little consistency for the sector on both ‘Walk’ and ‘Talk’
Sector trends
We analysed the relationship between pay gap disclosure levels based on keywords and phrases (‘Talk’) and the reported mean hourly gender pay gap % (‘Walk’) for FTSE 100 companies between 2017 and 2021/22 to examine trends (see Appendix E for methodology).
We found that 14 of the 20 FTSE 100 Financial Services companies that disclosed in 2021/22 have higher than average gender pay gaps (‘Walk’) compared to the FTSE 100. Of these 14 with high pay gaps, the level of disclosure on the issues (‘Talk’) is split half and half when compared to the FTSE100 average (Appendix A).
This indicates that overall, the sector is talking a lot about the issue, but still struggling to reduce its pay gap in line with other large businesses in the UK (Appendix D).
Companies vary widely when it comes to their relationship between ‘Walk’ vs ‘Talk’ (Appendix C), with some in danger of being called out for ‘social washing’ or on the other hand, lack of engagement.
On the agenda since 2017
Since 2017, companies of a certain size in the UK have been required to report their gender pay gap metrics. The intention is that transparency will drive accountability and action among businesses to address the issue and reduce inequality.
In the 5 years since, Insig AI’s data shows that while ‘Talk’ among the Financial Services sector has more than doubled from an average of 106 mentions to 232, the actual pay gap has reduced from 29.5% to 24.7%, still above the 19% FTSE100 average.
What GPG means in ESG
The gender pay gap metric is used by investors and ESG ratings agencies as one of the indicators of how a company manages its workforce risk and opportunity as part of ESG assessment. Research repeatedly shows that an equitable and diverse workforce is ‘good for business’.
The two companies that did not disclose their numbers either to Gov.UK or through their own reporting are opting out based on number of UK sub-entity employees falling below the regulatory threshold of 250.
Lacking consistency
The research shows that the Financial Services sector has one of the largest ranges between individual companies’ gender pay gaps (‘Walk’) of all sectors, along with the Consumer Discretionary and Consumer Staples sectors. The data also reveals a high dispersion on levels of Talk, second only to Consumer Staples (Appendix B).
This suggests this peer group of companies are very taking different approaches to the issue, which may impact their reputation through an ESG lens.
Commentary (Diana Rose, Head of ESG Research)
We know that different sectors have unique profiles when it comes to gender and diversity, bringing legacies and cultures that play out in metrics such as the gender pay gap. We also know this isn’t simple, and absolutely not about quick fixes.
But, it has been 5 years since regulation made it crystal clear to corporates that their stakeholders care about the gender pay gap, and want to see considered, committed, courageous action.
The FTSE 100 data appears to be moving in the right direction, but it seems the finance industry still has a long way to go. There’s wide variety in how companies are tackling the issue.
When there is all the ‘Talk’ and the needle still isn’t moving on the ‘Walk’, then businesses must be called out as this can be evidence of ‘social washing’. At the same time, some firms are lagging not only on bringing the ‘Walk’ % metric down, but also when it comes to ‘Talk’, which is just as concerning.
Suffragette Emily Davison famously said, ‘deeds, not words’. But words still matter here, as they wrap around the deed with the ‘why’, the ‘what’ and ‘how’.
The Government wants the metrics, but also encourages companies to disclose their strategies and action plans to address the pay gap, wherever it is. Transparency through disclosure is essential to give context, clarity and accountability around the number, which can never tell the full story by itself.
From an investor’s perspective, if a finance company still isn’t engaging on gender diversity in 2022, then questions have to be raised about how well it is managing other workforce issues that will limit its talent pool, skills retention, diversity of thought, reputation and resilience (https://hbr.org/2018/07/the-other-diversity-dividend).
Gender is fundamental, but just the start; other diversity factors such as ethnicity, age, disability, and education that are not only fundamental to an equitable society, but important for building a brilliant and future-fit workforce.
Appendix A
Scatter graph of all FTSE 100 companies by ‘Walk’ and ‘Talk’, divided in 4 groups in relation to the averages.
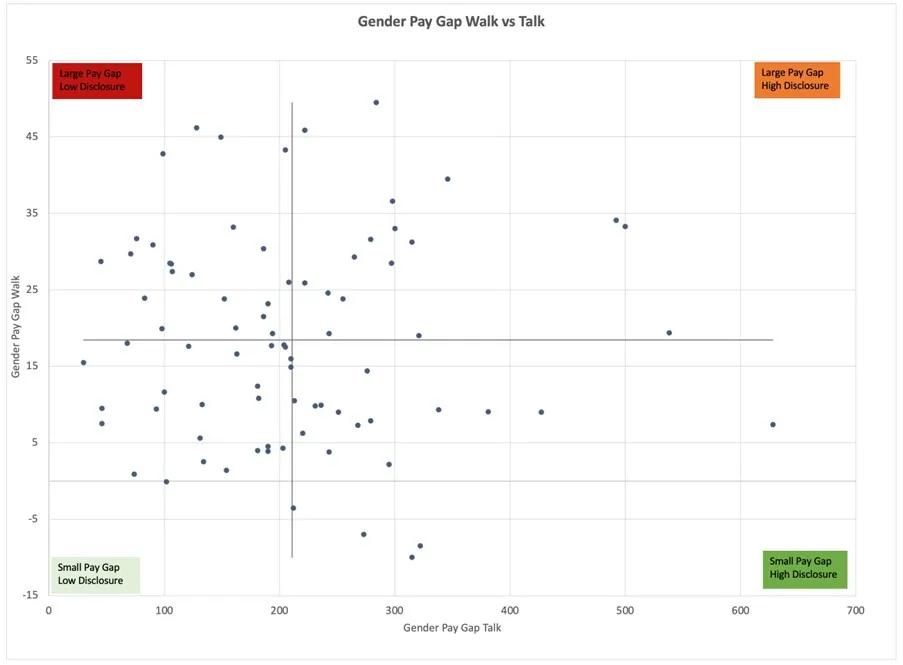
Table of FTSE 100 Financial Services companies, divided into 4 groups in relation to FTSE 100 average.

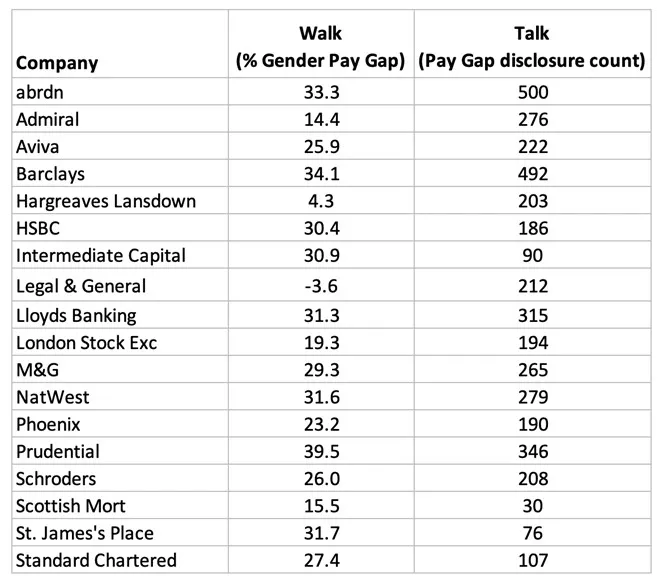
Table of FTSE 100 Financial Services sector companies’ ‘Walk’ and ‘Talk’ data, 2021/22.
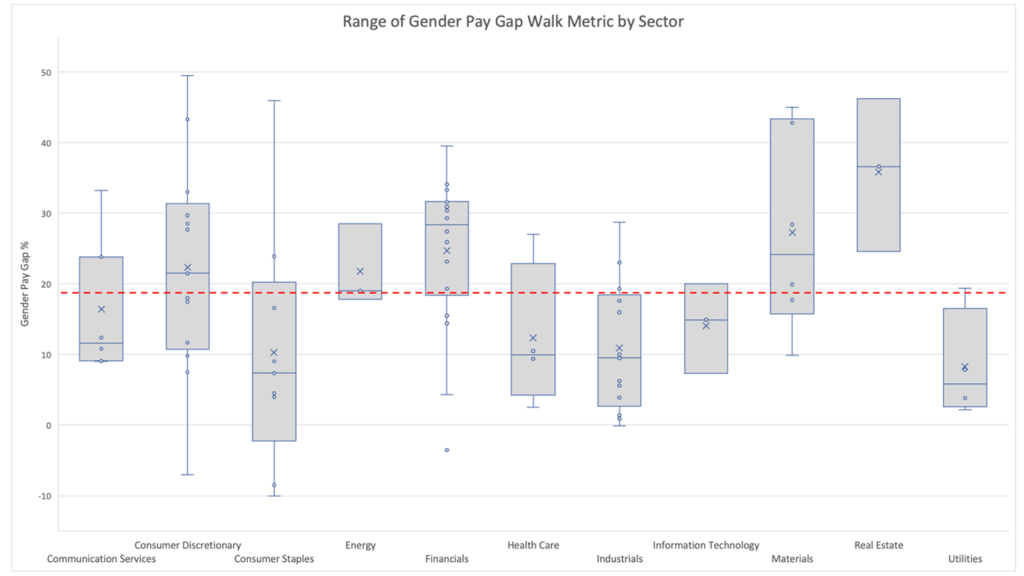
Appendix B
Range of gender pay gap metric by sector (‘Walk’), 2021/22
Range of pay gap disclosure levels by sector (‘Talk’), 2021/22
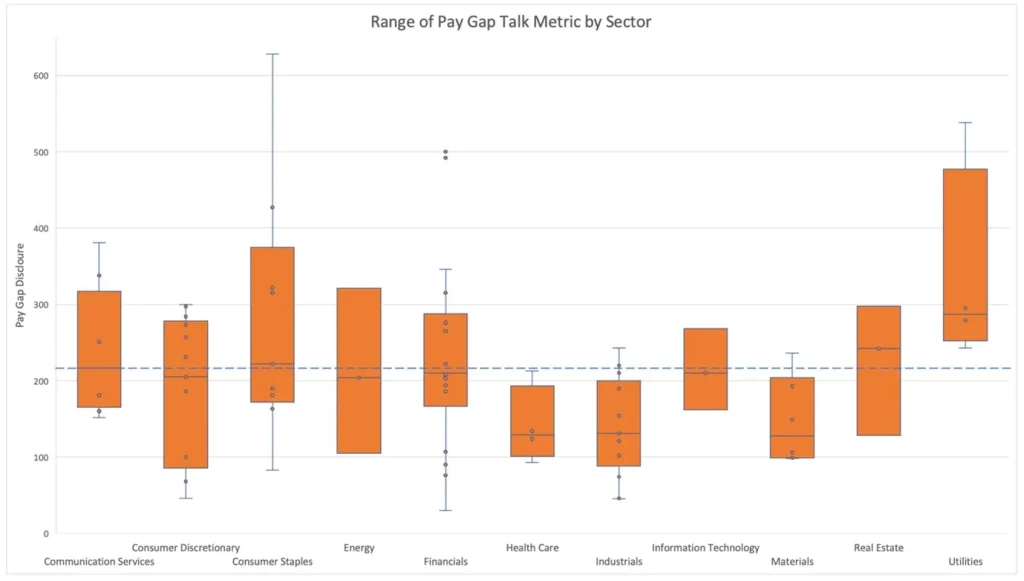
How the read the chart
The Box and Whisker chart shows the range of disclosure counts within a sector. All values are ranked from smallest to largest.
Appendix C
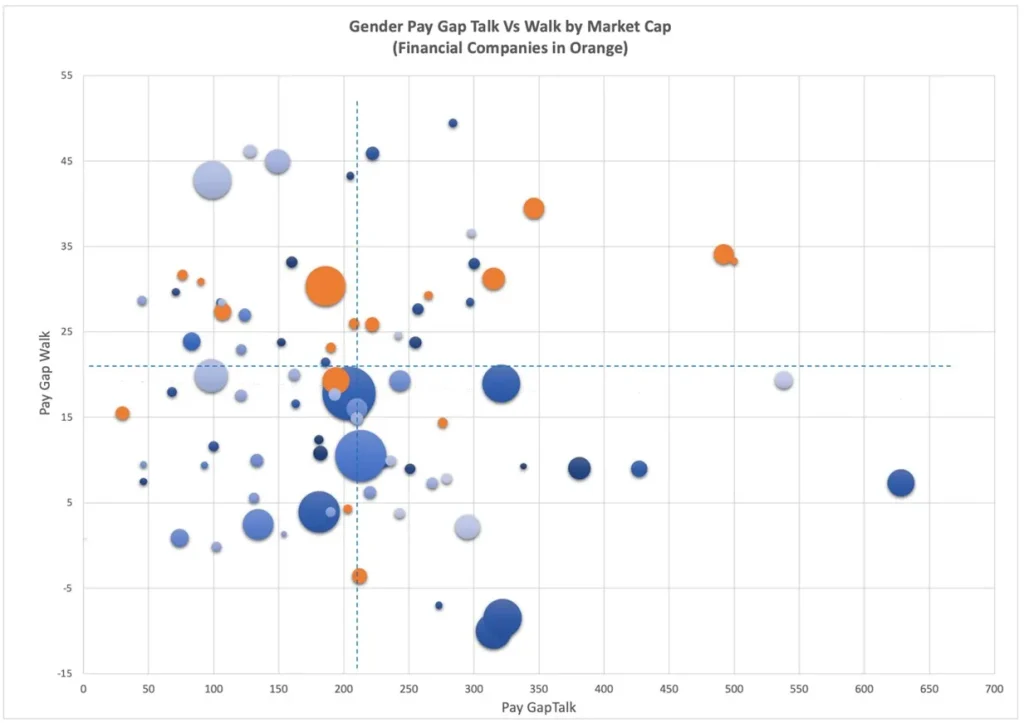
Scatter graph of all FTSE 100 companies in scope by Walk, Talk, and market cap, 2021/22
Appendix D
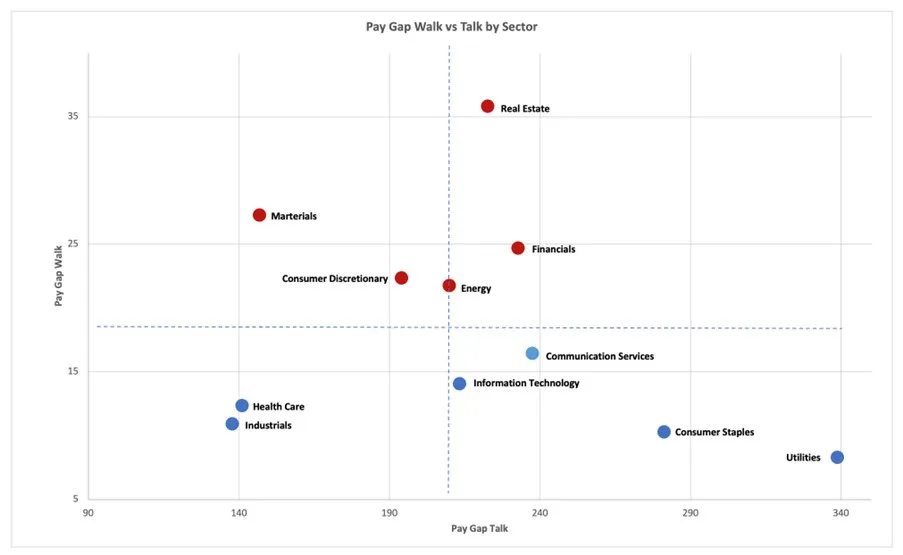
Sector averages for the FTSE 100 for ‘Walk’ and ‘Talk’, 2021/22
Appendix E
Insig AI Methodology
Scope
We have analysed the companies that make up the UK FTSE 100 (as at May 2022) and collected data from 2018-2022.
Data sources – quantitative and qualitative
- Quantitative (‘Walk’)
We use the publicly available gender pay gap metrics as reported by each company to the UK Government (https://gender-pay-gap.service.gov.uk/). This is a requirement for all companies in the UK with over 250 employees.
Eight pay gap metrics are reported, and we have chosen to use the mean pay gap based on hourly pay, which is explained on the website as providing a ‘good overall indication’ of the gap.
Where companies do not report on the Gov.UK platform, the metric is collected manually by searching for relevant pay gap reports in the public domain.
The gender pay gap is expressed as a % and referred to as ‘pay gap metric’ or ‘Walk’.
- Qualitative (‘Talk’)
We measure the volume of disclosure around pay gap terms and phrases, counted across each company’s body of corporate disclosures as published as PDFs on their websites.
The documents in scope include Annual Reports, Sustainability and ESG Reports, Diversity and Inclusion Reports, and Pay Gap Reports, as well as other financial and ESG related documents. These are manually collected, tagged and validated by our analysts.
PDF documents are converted to machine readable text which is run through a search technology that returns counts of exact matches per document. These counts then summed to produce a total per company per year on which the analysis is based; referred to ‘pay gap disclosure or ‘Talk’.
The terms/phrases counted are as follows and are designed to capture how much a company is talking about these issues. They are based on established and progressive ESG framework metrics:
| Gender related | Generic talk | Other diversity factors / emerging metrics |
| Gender pay gapGender balanceFemale average payMale average payEqual payGender bonus gapGender diversityWomen on the boardGender representationBoard representationBonus gap | InclusionDiversityEqualityFair payWork life balanceInclusive recruitmentBlack Lives MatterLGBTQ | Living wageEthnicity pay gapDiversity pay gapRetention rateParental leaveReturn to work rateAge representationDiversity representationDiversity and inclusion training |
NOTE: We use a combined 2021/22 pay gap quantitative metric which takes the data point most recently available. This is due to companies publishing at different times. If a company’s 2021 or 2022 metric cannot be sourced, the company is excluded from the analysis.